Short Answer
The graph of a linear inequality is shown below. Tell whether each point satisfies the inequality. 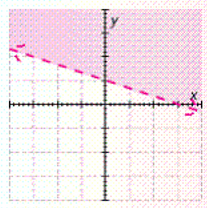
Answer yes or no . (-1,3) __________ (3,-3)__________ (0,0) __________ (-4,-2)__________
Correct Answer:

Verified
Correct Answer:
Verified
Related Questions
Q175: Solve the equation. <span class="ql-formula"
Q176: Solve the inequality <span class="ql-formula"
Q177: Solve the compound inequality. Graph the
Q178: Solve the inequality. Graph the solution
Q179: Solve the compound inequality. Graph the
Q181: Solve the equation. <span class="ql-formula"
Q182: Graph the inequality on a rectangular
Q183: A student has scores of 71, 73,
Q184: Graph the inequality. <span class="ql-formula"
Q185: Solve the equation. <span class="ql-formula"