Multiple Choice
Which of the following illustrations best represents a bar graph?
A) 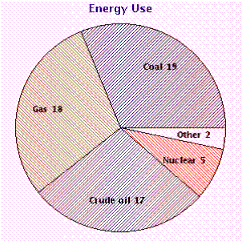
B) 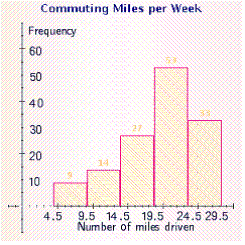
C) 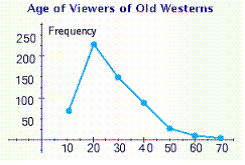
D) 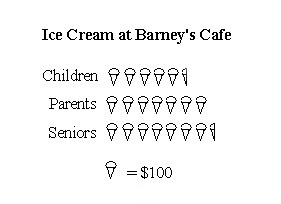
E) 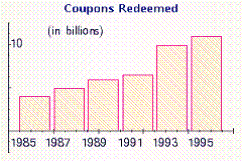
Correct Answer:

Verified
Correct Answer:
Verified
Related Questions
Q35: Find the weighted mean of a
Q36: Refer to the following spinner. If
Q37: Use the data in the table
Q38: Raul has an adjusted income of $153,850,
Q39: Find the semester grade point average
Q40: Match the type of information with the
Q41: An ordinary die is rolled once.
Q42: Use the data in the table
Q43: Refer to the line graph.<br>In approximately what
Q45: What is the event " getting numbers, whose sum is more then 6 "