Multiple Choice
Which of the following illustrations best represents a bar graph?
A) 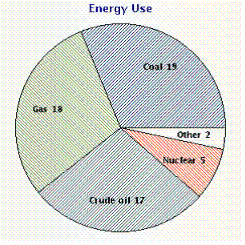
B) 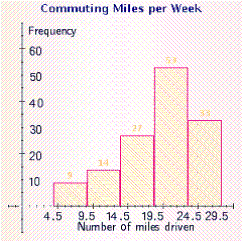
C) 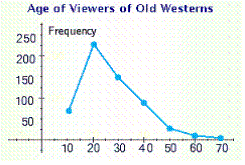
D) 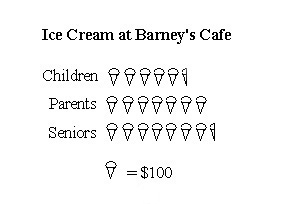
E) 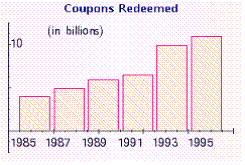
Correct Answer:

Verified
Correct Answer:
Verified
Related Questions
Q24: Find the weighted mean of a
Q25: Refer to the line graph.<br>In approximately what
Q25: Find the mean of the list of
Q26: Which of the following illustrations is a
Q28: Use the data in the table
Q29: Several groceries reported differing prices for a
Q30: How many more pet cats are there
Q30: Which of the following illustrations is a
Q31: Use the following bar graph to find
Q34: Several computer stores reported differing prices for