Multiple Choice
Which of the following illustrations is a frequency polygon?
A) 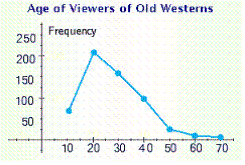
B) 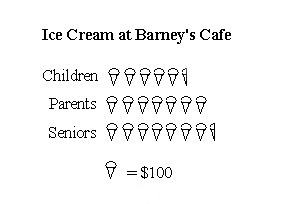
C) 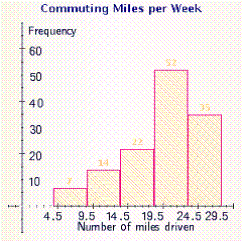
D) 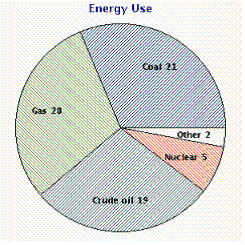
E) 
Correct Answer:

Verified
Correct Answer:
Verified
Related Questions
Q25: Refer to the line graph.<br>In approximately what
Q26: Which of the following illustrations is a
Q27: Which of the following illustrations best represents
Q28: Use the data in the table
Q29: Several groceries reported differing prices for a
Q31: Use the following bar graph to find
Q33: Match the type of information with the
Q34: Several computer stores reported differing prices for
Q34: The class results on a mathematical
Q35: Which of the following illustrations represents a