Short Answer
Use the following bar graph to find the average number of therms of natural gas used per month. 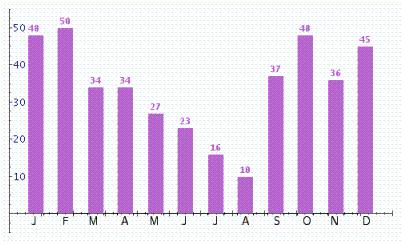
Correct Answer:

Verified
Correct Answer:
Verified
Related Questions
Q26: Which of the following illustrations is a
Q27: Which of the following illustrations best represents
Q28: Use the data in the table
Q29: Several groceries reported differing prices for a
Q30: Which of the following illustrations is a
Q33: Match the type of information with the
Q34: Several computer stores reported differing prices for
Q34: The class results on a mathematical
Q35: Which of the following illustrations represents a
Q36: Raul has an adjusted income of $153,850,