Multiple Choice
Draw a circle graph. In the United States for 2000, the percentage of national household income by quintiles was as follows: 1st, 4%; 2nd, 17.1%; 3rd, 36.7%; 4th, 24.4%; 5th, 17.8%.
A) 
B) 
C) 
D) 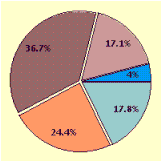
Correct Answer:

Verified
Correct Answer:
Verified
Related Questions
Q77: <img src="https://d2lvgg3v3hfg70.cloudfront.net/TBX8813/.jpg" alt=" A technician is
Q78: The mileage on six vehicles leased
Q79: The sample space is the set
Q80: From the following grouped data, find
Q81: A spinner has numbers 1-7 marked
Q83: In one month, the sales of
Q84: Find the sample standard deviation from
Q85: <img src="https://d2lvgg3v3hfg70.cloudfront.net/TBX8813/.jpg" alt=" A technician is
Q86: Use the figure below to answer the
Q87: Find the median measurement for the