Multiple Choice
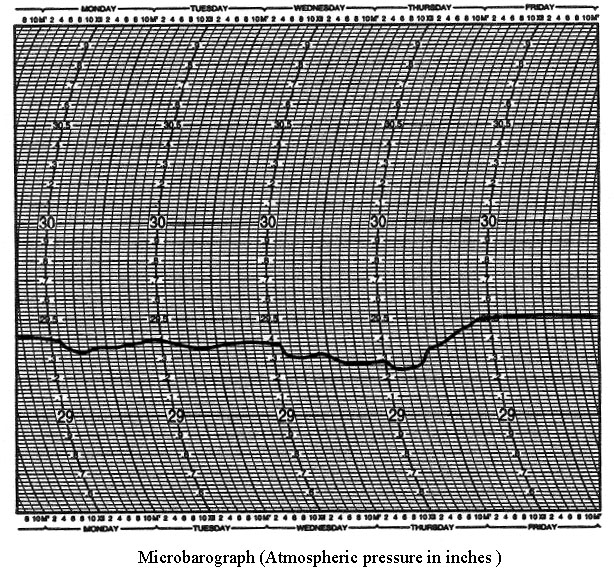 A technician is often asked to read graphs drawn by a machine. The machine records measurements by plotting them on a graph. Any field in which quality control or continuous information is needed might use this way of recording measurements. The figure labeled "Microbarograph (Atmospheric pressure in inches) " shows a microbarograph used by the weather service to record atmospheric pressure in inches. When was the highest atmospheric pressure recorded?(Select the day.)
A) Friday
B) Wednesday
C) Thursday
D) Saturday
E) Tuesday
Correct Answer:

Verified
Correct Answer:
Verified
Q80: From the following grouped data, find
Q81: A spinner has numbers 1-7 marked
Q82: Draw a circle graph. In the United
Q83: In one month, the sales of
Q84: Find the sample standard deviation from
Q86: Use the figure below to answer the
Q87: Find the median measurement for the
Q88: Find the median measurement for the
Q89: Draw a histogram for the data
Q90: The life expectancy of a fluorescent