Multiple Choice
Use the figure below to answer the following question. 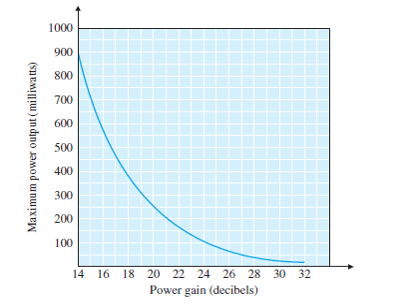 Between what two decibel readings is the least change in power output found? (Hint: assume that db readings were taken at the following points: 18, 20, 22, 24, 26, 28, 30, 32)
A) 24 db and 26 db
B) 20 db and 22 db
C) 22 db and 24 db
D) 30 db and 32 db
E) 20 db and 26 db
Correct Answer:

Verified
Correct Answer:
Verified
Q81: A spinner has numbers 1-7 marked
Q82: Draw a circle graph. In the United
Q83: In one month, the sales of
Q84: Find the sample standard deviation from
Q85: <img src="https://d2lvgg3v3hfg70.cloudfront.net/TBX8813/.jpg" alt=" A technician is
Q87: Find the median measurement for the
Q88: Find the median measurement for the
Q89: Draw a histogram for the data
Q90: The life expectancy of a fluorescent
Q91: Consider the following bar graph. What is