Multiple Choice
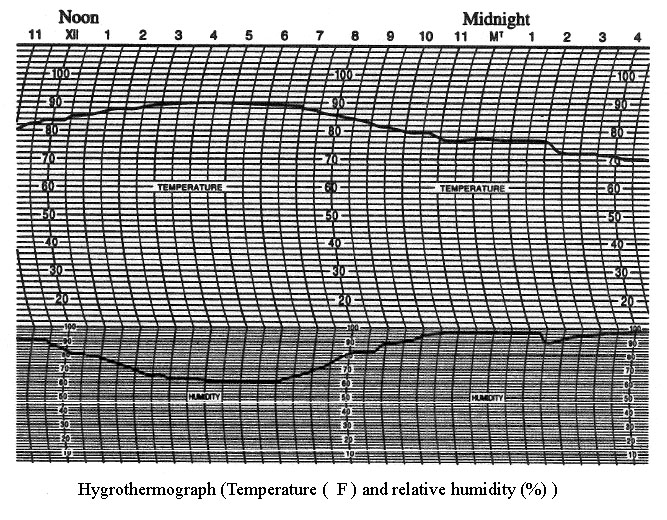
 A hygrothermograph is used by the weather services to record temperature and relative humidity (see figure labeled "Hygrothermograph") . The lower part of the graph is used to measure relative humidity from 0% to 100%. The upper part of the graph is used to measure temperature from 10° F to 110° F. What was the highest temperature recorded? Use the data in the figure to answer this question.
A) 85° F
B) 100° F
C) 80° F
D) 90° F
E) 95° F
Correct Answer:

Verified
Correct Answer:
Verified
Q122: The following list gives 50 pieces
Q123: The mileage on six vehicles leased
Q124: The table below shows the average
Q125: Consider the following bar graph. What is
Q126: Find the sample standard deviation from
Q128: Find the median measurement for the
Q129: The shipment times in hours for
Q130: Find the median measurement for the
Q131: The sample space is the set
Q132: <span class="ql-formula" data-value="\begin{array}{|lc|}\hline \text { Shipment time