Multiple Choice
The shipment times in hours for a load of goods from a factory to market are tabulated in the frequency distribution in the table below. Draw a histogram for the data displayed.
A) 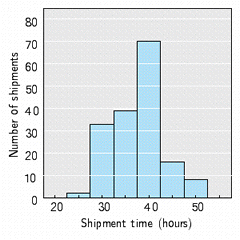
B) 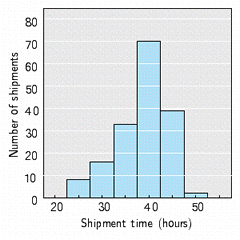
C) 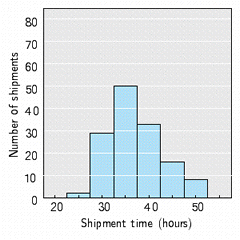
D) 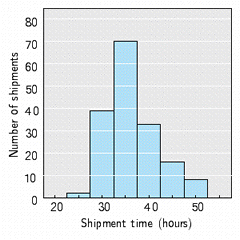
E) 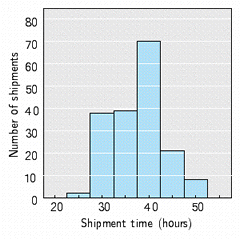
Correct Answer:

Verified
Correct Answer:
Verified
Q124: The table below shows the average
Q125: Consider the following bar graph. What is
Q126: Find the sample standard deviation from
Q127: <img src="https://d2lvgg3v3hfg70.cloudfront.net/TBX8813/.jpg" alt=" A hygrothermograph is
Q128: Find the median measurement for the
Q130: Find the median measurement for the
Q131: The sample space is the set
Q132: <span class="ql-formula" data-value="\begin{array}{|lc|}\hline \text { Shipment time
Q133: A department spends $16,349 of its $181,500
Q134: Find the mean measurement for the set