Multiple Choice
The table below shows the average test scores on chapter tests given in a mathematics class. Draw a bar graph for these scores.
A) 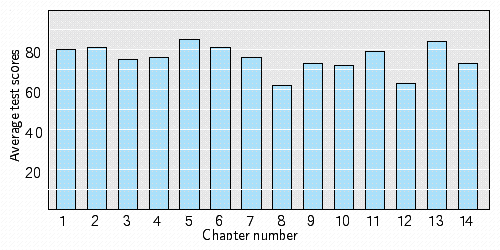
B) 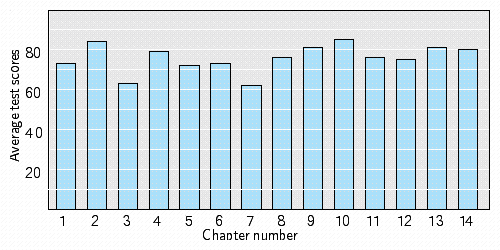
C) 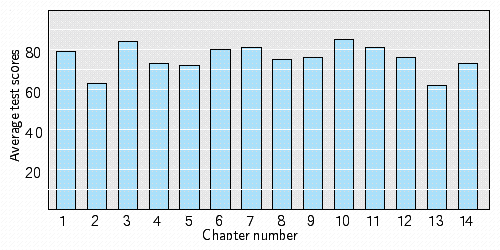
D) 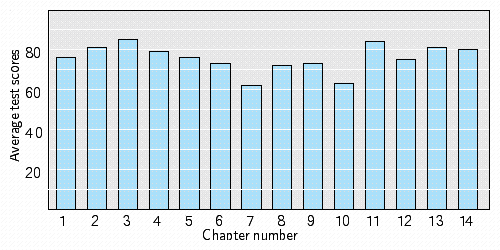
E) 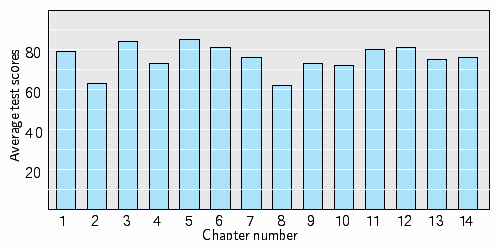
Correct Answer:

Verified
Correct Answer:
Verified
Related Questions
Q119: Find the median measurement for the
Q120: Consider the following bar graph. How many
Q121: Consider the following bar graph. What country
Q122: The following list gives 50 pieces
Q123: The mileage on six vehicles leased
Q125: Consider the following bar graph. What is
Q126: Find the sample standard deviation from
Q127: <img src="https://d2lvgg3v3hfg70.cloudfront.net/TBX8813/.jpg" alt=" A hygrothermograph is
Q128: Find the median measurement for the
Q129: The shipment times in hours for