Short Answer
Consider the following bar graph. How many barrels of oil per day were used by the United States? 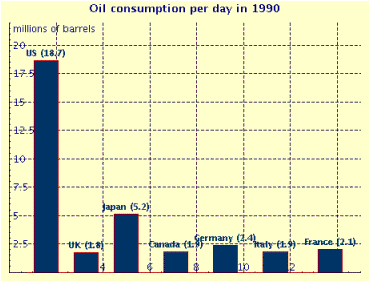 __________ million barrels
Correct Answer:

Verified
Correct Answer:
Verified
Related Questions
Q40: Find the mean measurement for the set
Q41: Consider the following bar graph. How many
Q42: Find the sample standard deviation from
Q43: A certain manufacturing process has a
Q44: Find the sample space of the diamonds
Q46: A coin is tossed, and a
Q47: Draw a circle graph. In 1996, the
Q48: Find 65% of 360<sup>o</sup><br>A) 306<sup>o</sup><br>B) 270<sup>o</sup><br>C) 234<sup>o</sup><br>D)
Q49: The sample space is the set
Q50: Find the sample standard deviation from