Multiple Choice
During the years 1994 to 2007 seat belt use among front seat passengers ages 16 to 24 has increased. A linear model for the percentage of these passengers who use a seat belt is 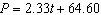 where P is percentage with a seat belt and t is years since 2000. The years before 2000 have a negative value for t. What is the slope of the model and what does it mean in terms of the problem?
A) 2.33. Every year seat belt use goes down 2.33.
B) 2.33. Every year seat belt use goes down 2.33%
C) 2.33. Every year seat belt use goes up 2.33%
D) 64.60. Seat belt use started at 64.60%
Correct Answer:

Verified
Correct Answer:
Verified
Q34: During the years 1994 to 2007 seat
Q35: You have moved to Chicago in the
Q36: When you estimate an output value for
Q37: You are given a quadratic model <img
Q38: The graph shows the average monthly high
Q40: A quadratic model for the median home
Q41: During the years 1994 to 2007 seat
Q42: The average profit in dollars A that
Q43: Given the data set draw a scatterplot.
Q44: If a quadratic model <img src="https://d2lvgg3v3hfg70.cloudfront.net/TBX8673/.jpg" alt="If