Multiple Choice
The graph shows the average monthly high temperature in Newark NJ for months from April to September. If a quadratic model  is fit to the graphed data set estimate the coordinates of the vertex.
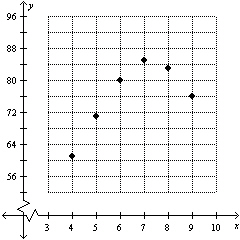
A) 
B) 
C) 
D) 
Correct Answer:

Verified
Correct Answer:
Verified
Related Questions
Q33: The graph shows the average monthly high
Q34: During the years 1994 to 2007 seat
Q35: You have moved to Chicago in the
Q36: When you estimate an output value for
Q37: You are given a quadratic model <img
Q39: During the years 1994 to 2007 seat
Q40: A quadratic model for the median home
Q41: During the years 1994 to 2007 seat
Q42: The average profit in dollars A that
Q43: Given the data set draw a scatterplot.