Multiple Choice
During the years 1994 to 2007 seat belt use among front seat passengers ages 16 to 24 has increased. A linear model for the percentage of these passengers who use a seat belt is 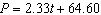 where P is percentage with a seat belt and t is years since 2000. The years before 2000 have a negative value for t. What is the vertical intercept of the model and what does it mean in terms of the problem?
A)  . In the year 1994 seat belt use was 64.60.
B)  . In the year 2000 seat belt use was 64.60.
C) 2.33. Every year seat belt use goes up 2.33%
D)  . In the year 2000 seat belt use was 64.60%.
Correct Answer:

Verified
Correct Answer:
Verified
Q36: When you estimate an output value for
Q37: You are given a quadratic model <img
Q38: The graph shows the average monthly high
Q39: During the years 1994 to 2007 seat
Q40: A quadratic model for the median home
Q42: The average profit in dollars A that
Q43: Given the data set draw a scatterplot.
Q44: If a quadratic model <img src="https://d2lvgg3v3hfg70.cloudfront.net/TBX8673/.jpg" alt="If
Q45: The percentage P of 6 to 11
Q46: The graph shows the average monthly high