Multiple Choice
The graph shows the average monthly high temperature in Newark NJ for months from November to April. If a quadratic model  is fit to the graphed data set will a be positive or negative?
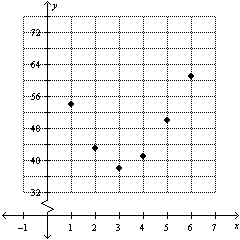
A) positive
B) negative
Correct Answer:

Verified
Correct Answer:
Verified
Related Questions
Q28: The percentage of eighth grade students P
Q29: You have moved to Chicago in the
Q30: The graph shows the average monthly high
Q31: The percentage of eighth grade students P
Q32: A quadratic model for the median price
Q34: During the years 1994 to 2007 seat
Q35: You have moved to Chicago in the
Q36: When you estimate an output value for
Q37: You are given a quadratic model <img
Q38: The graph shows the average monthly high