Multiple Choice
The graph shows the average monthly high temperature in Newark NJ for months from November to April. If a quadratic model  is fit to the graphed data set estimate the coordinates of the vertex.
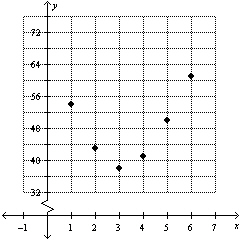
A) 
B) 
C) 
D) 
Correct Answer:

Verified
Correct Answer:
Verified
Related Questions
Q60: If the prediction of the output value
Q61: Given the data set choose its scatterplot.
Q62: Decide which line fits the data best.<br>A)
Q63: You are given a quadratic model <img
Q64: Given the data set draw a scatterplot.
Q66: The average profit in dollars A that
Q67: Given the data set draw a scatterplot.
Q68: The Supplemental Nutrition Assistance Program (SNAP) to
Q69: The Supplemental Nutrition Assistance Program (SNAP) to
Q70: The percentage P of 6 to 11