Essay
Given the data set draw a scatterplot. Clearly label and scale the axes. Are the data approximately linear?
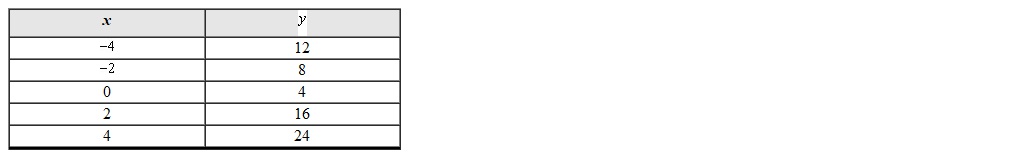
Correct Answer:

Verified
Correct Answer:
Verified
Related Questions
Q59: During the years 1994 to 2007 seat
Q60: If the prediction of the output value
Q61: Given the data set choose its scatterplot.
Q62: Decide which line fits the data best.<br>A)
Q63: You are given a quadratic model <img
Q65: The graph shows the average monthly high
Q66: The average profit in dollars A that
Q67: Given the data set draw a scatterplot.
Q68: The Supplemental Nutrition Assistance Program (SNAP) to
Q69: The Supplemental Nutrition Assistance Program (SNAP) to