Related Questions
Q57: Given the data set draw a scatterplot.
Q58: The population of Florida is given in
Q59: During the years 1994 to 2007 seat
Q60: If the prediction of the output value
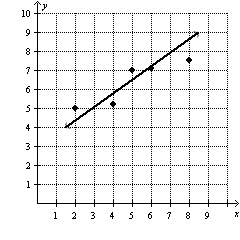
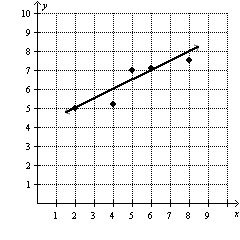
Q61: Given the data set choose its scatterplot.
Q63: You are given a quadratic model <img
Q64: Given the data set draw a scatterplot.
Q65: The graph shows the average monthly high
Q66: The average profit in dollars A that
Q67: Given the data set draw a scatterplot.