Multiple Choice
In the log-likelihood figure shown, which of the following ranges best matches the 95% confidence interval for the values on the X-axis?
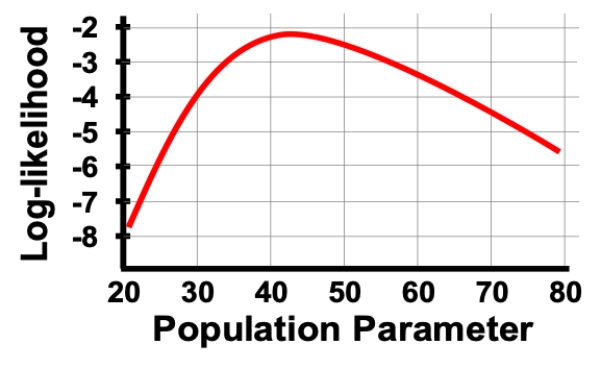
A) 25 to 70
B) 30 to 65
C) 35 to 60
D) 40 to 55
Correct Answer:

Verified
Correct Answer:
Verified
Related Questions
Q15: The maximum likelihood estimate of a parameter
Q16: The maximum likelihood approach is very powerful
Q17: The bias in maximum likelihood estimation is
Q18: When comparing alternative phylogenies to decide on
Q19: Likelihood measures which of the following?<br>A) How
Q21: Which of the following is the
Q22: The maximum likelihood estimate will always give
Q23: Likelihood measures the probability we would get
Q24: Consider a situation in which we plot
Q25: In the log-likelihood figure shown, which of