Not Answered
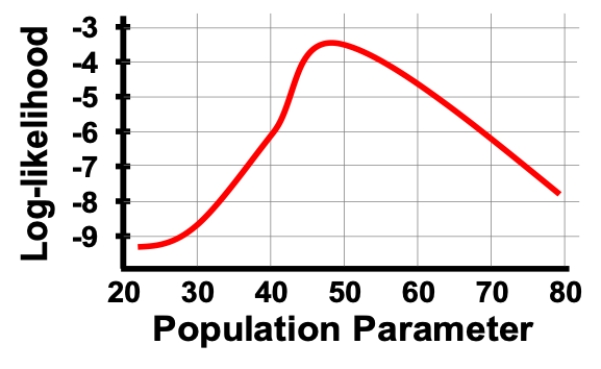
Consider a situation in which we plot the log-likelihood values for a range of parameter values as shown in the figure. What is the MLE and 95% confidence interval of the MLE based on this figure?
Correct Answer:

Verified
Correct Answer:
Verified
Related Questions
Q19: Likelihood measures which of the following?<br>A) How
Q20: In the log-likelihood figure shown, which of
Q21: Which of the following is the
Q22: The maximum likelihood estimate will always give
Q23: Likelihood measures the probability we would get
Q25: In the log-likelihood figure shown, which of
Q26: Describe how and why we can use
Q27: A good rule of thumb for the
Q28: When using likelihood to find the locations
Q29: When using maximum likelihood to choose the