Multiple Choice
In the log-likelihood figure shown, which of the following ranges best matches the 95% confidence interval for the values on the X-axis?
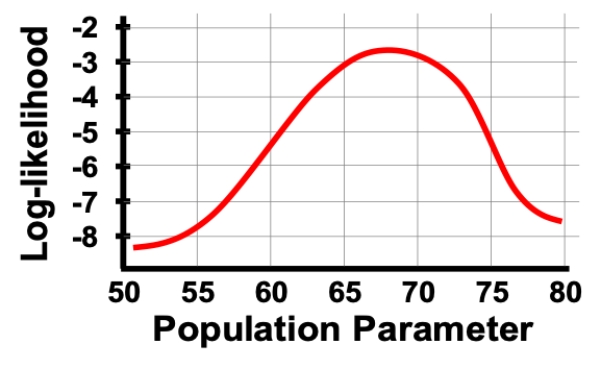
A) 58 to 78
B) 60 to 76
C) 62 to 74
D) 64 to 72
Correct Answer:

Verified
Correct Answer:
Verified
Related Questions
Q20: In the log-likelihood figure shown, which of
Q21: Which of the following is the
Q22: The maximum likelihood estimate will always give
Q23: Likelihood measures the probability we would get
Q24: Consider a situation in which we plot
Q26: Describe how and why we can use
Q27: A good rule of thumb for the
Q28: When using likelihood to find the locations
Q29: When using maximum likelihood to choose the
Q30: When we use the maximum likelihood method