Multiple Choice
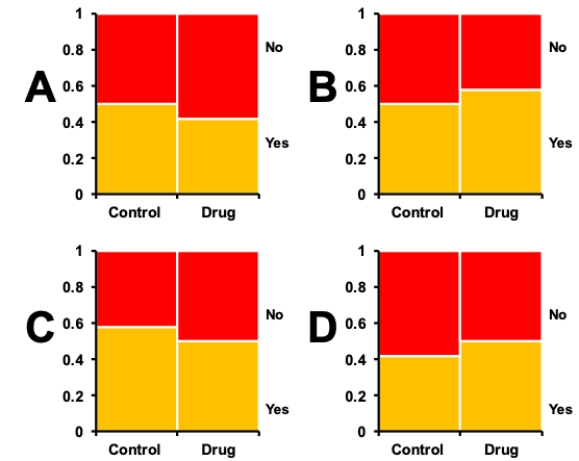
Consider a situation in which bacterial swabs were taken from the ears and noses of 50 study subjects, and the number of swabs that showed the presence of staphylococcus were measured. The table shows the results of the measurements. Which of the grouped bar graphs shown correctly depicts this data?
?
Contingency table showing presence of tumors in rats with different drug regimes.
? ?
?
A) Plot A
B) Plot B
C) Plot C
D) Plot D
Correct Answer:

Verified
Correct Answer:
Verified
Q6: Which of the following is NOT true
Q7: Which of the bar charts shown
Q8: Draw a graph showing hypothetical data in
Q9: Sketch out a histogram (with 5 bins
Q10: Consider the histogram of a data set
Q12: Preparing figures typically follows data analysis.
Q13: One of the graphical methods in particular
Q14: Write out a procedure or recipe for
Q15: Mosaic plots and grouped bar graphs display
Q16: Consider an experiment in which female and