Multiple Choice
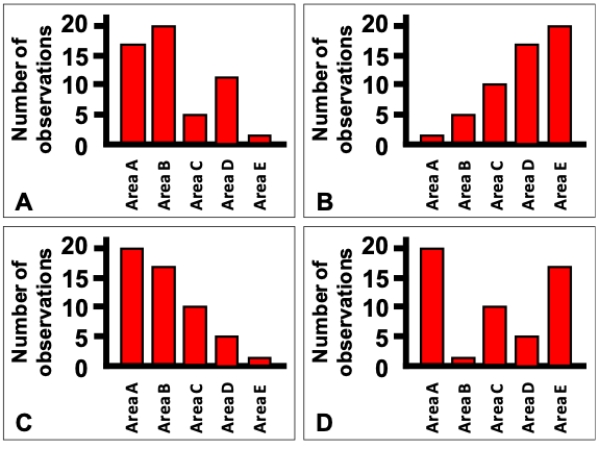
Which of the bar charts shown corresponds to the data table shown?
?
Frequency table showing the number of oak trees in each of 5 areas in a forest.
? ?
?
A) Chart A
B) Chart B
C) Chart C
D) Chart D
Correct Answer:

Verified
Correct Answer:
Verified
Related Questions
Q2: Consider a lake survey in which the
Q3: Consider an experiment in which an omnivorous
Q4: Three-dimensional figures are often the best way
Q5: Consider the histograms of a data set
Q6: Which of the following is NOT true
Q8: Draw a graph showing hypothetical data in
Q9: Sketch out a histogram (with 5 bins
Q10: Consider the histogram of a data set
Q11: Consider a situation in which bacterial
Q12: Preparing figures typically follows data analysis.