Multiple Choice
Consider an experiment in which an omnivorous species has its stomach contents analyzed. Which of the pie charts correctly depicts the following values for the diet of the omnivore: 20% grass, 40% leaves, 20% insects, 20% fish?
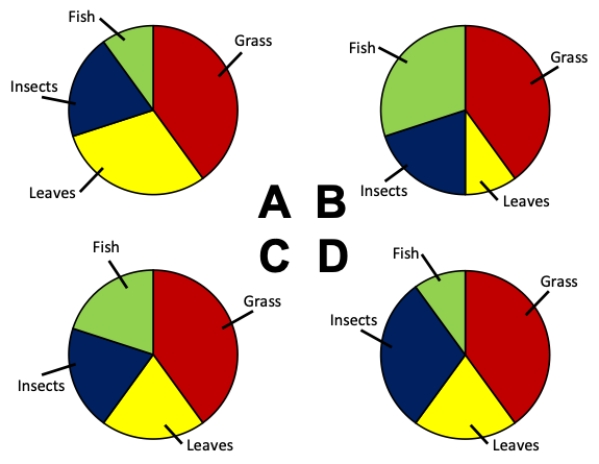
A) Chart A
B) Chart B
C) Chart C
D) Chart D
Correct Answer:

Verified
Correct Answer:
Verified
Related Questions
Q1: The type of figure that uses rectangles,
Q2: Consider a lake survey in which the
Q4: Three-dimensional figures are often the best way
Q5: Consider the histograms of a data set
Q6: Which of the following is NOT true
Q7: Which of the bar charts shown
Q8: Draw a graph showing hypothetical data in
Q9: Sketch out a histogram (with 5 bins
Q10: Consider the histogram of a data set
Q11: Consider a situation in which bacterial