Multiple Choice
The interaction plot shown most likely represents which of the following?
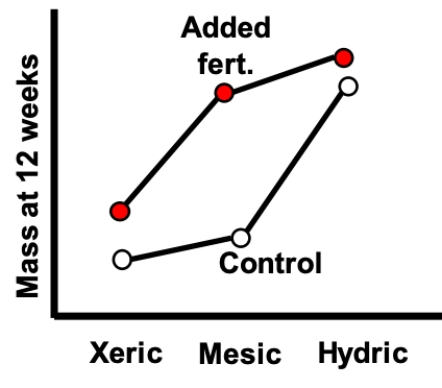
A) Associations with environment and fertilizer treatment, and an interaction
B) Associations with environment and fertilizer treatment, but no interaction
C) An association with environment, but no effect of fertilizer treatment or any interaction
D) An association with fertilizer treatment, but no effect of environment or any interaction
Correct Answer:

Verified
Correct Answer:
Verified
Q31: The analysis method called a two-way, fixed-effect
Q32: The interaction plot shown most likely represents
Q33: Most ANCOVA analyses do not include a
Q34: If the null hypothesis for a linear
Q35: For the figure shown, which of the
Q37: When the assumptions of the linear model
Q38: Consider an experiment using birds in which
Q39: Compare and contrast ANOVAs that use blocking
Q40: Adding blocks to a design is usually
Q41: In the preliminary stages of an ANCOVA