Multiple Choice
The interaction plot shown most likely represents which of the following?
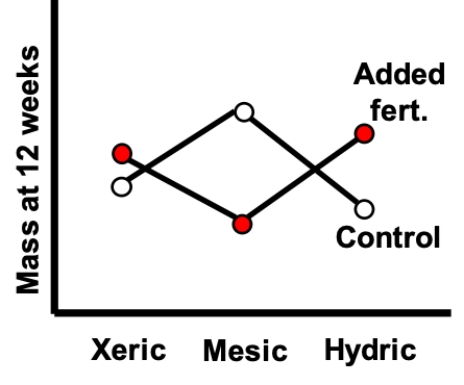
A) Associations with environment and fertilizer treatment, and an interaction
B) Associations with environment and fertilizer treatment, but no interaction
C) An association with environment and an interaction, but no association with fertilizer treatment
D) An association with fertilizer treatment and an interaction, but no association with environment
Correct Answer:

Verified
Correct Answer:
Verified
Q27: When linear models include more than one
Q28: When the assumptions of the linear model
Q29: Draw a flowchart showing the decisions you
Q30: The interaction plot shown most likely represents
Q31: The analysis method called a two-way, fixed-effect
Q33: Most ANCOVA analyses do not include a
Q34: If the null hypothesis for a linear
Q35: For the figure shown, which of the
Q36: The interaction plot shown most likely represents
Q37: When the assumptions of the linear model