Multiple Choice
For the figure shown, which of the four plots most likely shows a situation where one factor has a significant effect while the other does not?
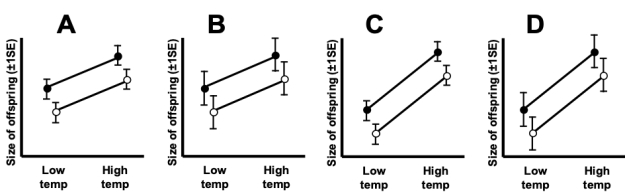
A) Plot A
B) Plot B
C) Plot C
D) Plot D
Correct Answer:

Verified
Correct Answer:
Verified
Related Questions
Q30: The interaction plot shown most likely represents
Q31: The analysis method called a two-way, fixed-effect
Q32: The interaction plot shown most likely represents
Q33: Most ANCOVA analyses do not include a
Q34: If the null hypothesis for a linear
Q36: The interaction plot shown most likely represents
Q37: When the assumptions of the linear model
Q38: Consider an experiment using birds in which
Q39: Compare and contrast ANOVAs that use blocking
Q40: Adding blocks to a design is usually