Multiple Choice
The interaction plot shown most likely represents which of the following?
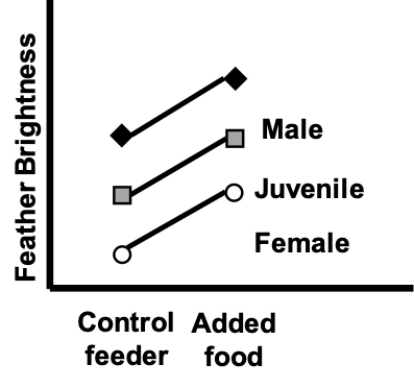
A) Associations with diet and bird age/sex, and an interaction
B) Associations with diet and bird age/sex treatment, but no interaction
C) An association with diet, but no effect of bird age/sex or any interaction
D) An association with fertilizer treatment, but no effect of diet or any interaction
Correct Answer:

Verified
Correct Answer:
Verified
Q25: For the figure shown, which of the
Q26: Imagine a factorial ANOVA design experiment with
Q27: When linear models include more than one
Q28: When the assumptions of the linear model
Q29: Draw a flowchart showing the decisions you
Q31: The analysis method called a two-way, fixed-effect
Q32: The interaction plot shown most likely represents
Q33: Most ANCOVA analyses do not include a
Q34: If the null hypothesis for a linear
Q35: For the figure shown, which of the