Multiple Choice
Figure 11-2
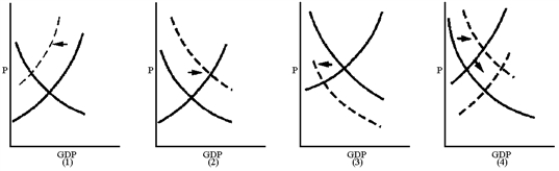
-Which graph in Figure 11-2 best reflects a Keynesian's view of the short-run impact of an increase in the personal income tax rate?
A) 1
B) 2
C) 3
D) 4
Correct Answer:

Verified
Correct Answer:
Verified
Q99: Figure 11-2<br> <img src="https://d2lvgg3v3hfg70.cloudfront.net/TB8592/.jpg" alt="Figure 11-2
Q100: Recessionary gaps can be cured by raising
Q101: Most of the taxes collected by governments
Q102: When the government taxes and spends, each
Q103: To close a recessionary gap, Keynesian theory
Q105: Transfer payments represent income that is not
Q106: When income taxes are included in the
Q107: Figure 11-2<br> <img src="https://d2lvgg3v3hfg70.cloudfront.net/TB8592/.jpg" alt="Figure 11-2
Q108: Figure 11-3<br> <img src="https://d2lvgg3v3hfg70.cloudfront.net/TB8592/.jpg" alt="Figure 11-3
Q109: Contractionary fiscal policy may have some undesirable