Multiple Choice
The figure given below represents the equilibrium real GDP and price level in the aggregate demand and aggregate supply model.
Figure 8.3
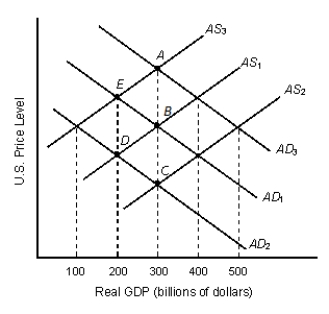
-Refer to Figure 8.3. Potential GDP is greater than real GDP at all output levels:
A) above $300 billion.
B) between $300 billion and $400 billion.
C) above $400 billion.
D) below $300 billion.
E) above $500 billion.
Correct Answer:

Verified
Correct Answer:
Verified
Q13: When the foreign price level falls, domestic
Q29: Given that energy is an input in
Q63: Each of the panels given below represents
Q69: The figure given below represents the equilibrium
Q72: A lower domestic price level raises aggregate
Q78: Which of the following is true of
Q81: The degree of responsiveness of aggregate output
Q93: A rightward shift in the aggregate supply
Q96: Which of the following could lead to
Q113: The wealth effect, the interest rate effect,