Multiple Choice
The figure given below represents the consumption function of a country.?Figure 9.3
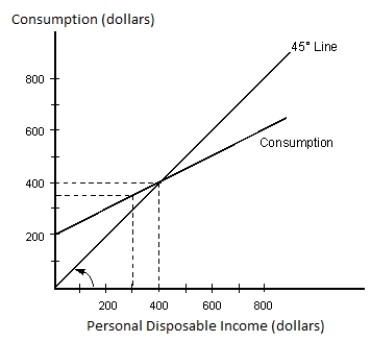
-Refer to Figure 9.3. If the marginal propensity to consume is equal to 0.3, then:
A) autonomous consumption would decrease.
B) the total amount of dissaving would increase.
C) consumption spending would equal disposable income at an income level greater than $400.
D) consumption spending would equal disposable income at an income level less than $400.
E) consumption spending would equal disposable income at the income level of $400.
Correct Answer:

Verified
Correct Answer:
Verified
Q17: Which of the following would cause a
Q20: Changes in autonomous consumption will affect the
Q28: The figure given below represents the consumption
Q65: Which of the following statements is true?<br>A)Real
Q66: The second-largest component of aggregate expenditures in
Q90: The 45-degree line used in a consumption
Q112: Other things equal, when Europeans want to
Q113: The figure given below shows the aggregate
Q118: The table given below reports the consumption
Q120: The figure given below shows the consumption