Multiple Choice
The figure given below shows the consumption function of a household.?Figure 9.2
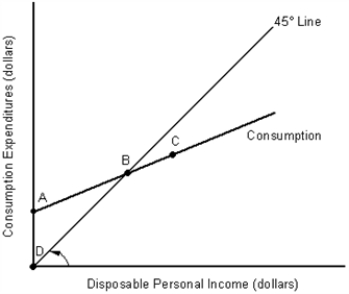
-In Figure 9.2, a decrease in disposable income would be illustrated by:
A) an upward shift of the consumption function.
B) a downward shift of the consumption function.
C) a leftward movement along the consumption function.
D) a rightward movement along the consumption function.
E) a movement from point A to point D.
Correct Answer:

Verified
Correct Answer:
Verified
Q17: Which of the following would cause a
Q20: Changes in autonomous consumption will affect the
Q28: The figure given below represents the consumption
Q65: Which of the following statements is true?<br>A)Real
Q66: The second-largest component of aggregate expenditures in
Q90: The 45-degree line used in a consumption
Q112: Other things equal, when Europeans want to
Q113: The figure given below shows the aggregate
Q118: The table given below reports the consumption
Q119: The figure given below represents the consumption