Multiple Choice
Which of the following graphs correctly represents an increase in the risk premium on the MP curve?
A) 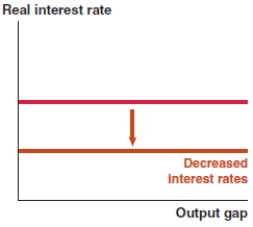
B) 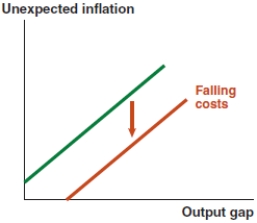
C) 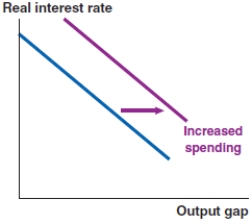
D) 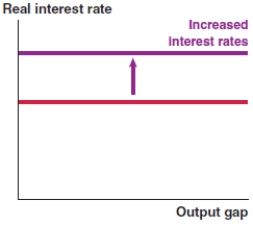
Correct Answer:

Verified
Correct Answer:
Verified
Related Questions
Q42: Explain the following concepts:<br>(a) financial shock<br>(b) spending
Q43: In the IS-MP analysis in the Fed
Q44: Suppose nominal wages fall in Bangladesh. Analyze
Q45: The economy shown here begins at a
Q46: The framework that the Federal Reserve uses
Q48: If the default risk rises in Greece,
Q49: Assume that the economy starts at a
Q50: The first step in analyzing a macroeconomic
Q51: If you see a newspaper headline that
Q52: Which of the following graphs correctly represents