Multiple Choice
Which of the following graphs correctly represents a negative spending shock on the IS curve?
A) 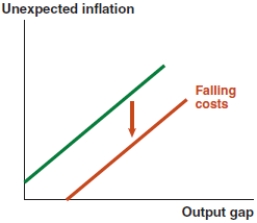
B) 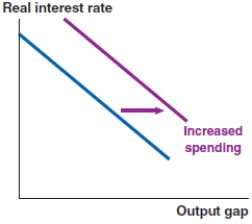
C) 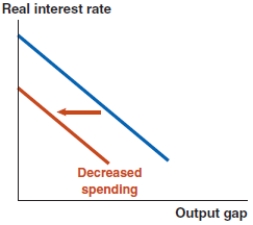
D) 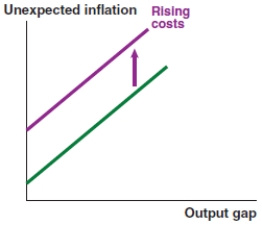
Correct Answer:

Verified
Correct Answer:
Verified
Related Questions
Q47: Which of the following graphs correctly represents
Q48: If the default risk rises in Greece,
Q49: Assume that the economy starts at a
Q50: The first step in analyzing a macroeconomic
Q51: If you see a newspaper headline that
Q53: Suppose there is a financial upheaval, which
Q54: The economy shown here begins at a
Q55: Take a look at the IS-MP-PC model
Q56: In the IS-MP analysis in the Fed
Q57: In the IS-MP analysis in the Fed