Multiple Choice
Assume that the economy starts at a 0% output gap. Now suppose that consumers fear a recession and reduce their spending. Based on this scenario, the economy experiences:
Figure A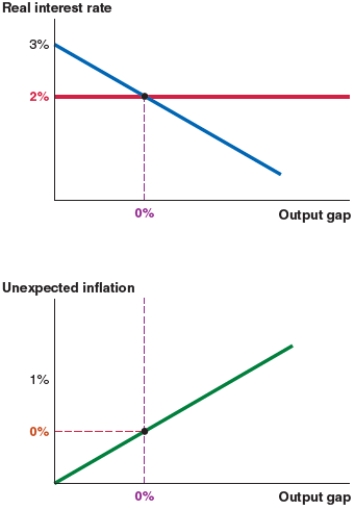
Figure B
Figure C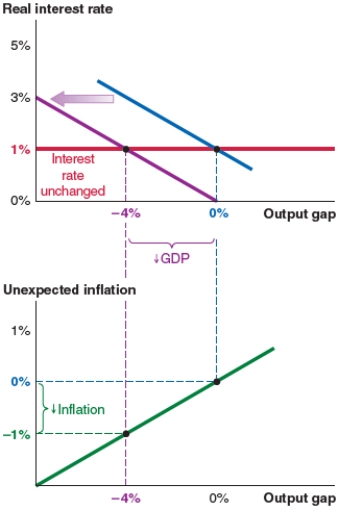
Figure D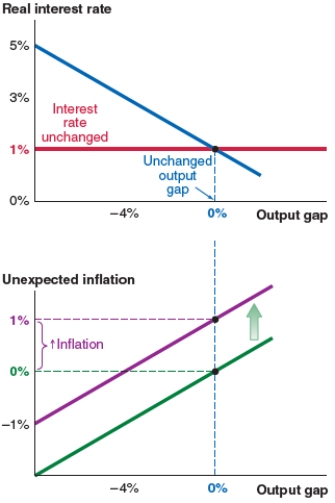
A) no change, as shown in Figure A.
B) an upward shift of the MP curve and a new interest rate of 3%, as shown in Figure B.
C) a leftward shift of the IS curve and an output gap of -4%, as shown in Figure C.
D) an upward shift of the Phillips curve and 1% unexpected inflation, as shown in Figure D.
Correct Answer:

Verified
Correct Answer:
Verified
Q44: Suppose nominal wages fall in Bangladesh. Analyze
Q45: The economy shown here begins at a
Q46: The framework that the Federal Reserve uses
Q47: Which of the following graphs correctly represents
Q48: If the default risk rises in Greece,
Q50: The first step in analyzing a macroeconomic
Q51: If you see a newspaper headline that
Q52: Which of the following graphs correctly represents
Q53: Suppose there is a financial upheaval, which
Q54: The economy shown here begins at a