Multiple Choice
The figure below shows production possibilities curves for tomatoes and oranges in two prefectures in a country.
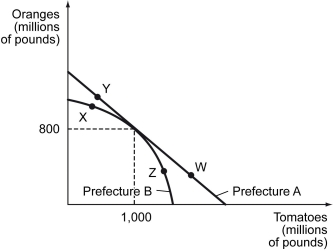
-Refer to the figure above.Which statement is true?
A) Prefecture A has a comparative advantage in tomato production.
B) Prefecture B has a comparative advantage in tomato production.
C) Prefecture A has a comparative advantage in tomato production up to 1 billion pounds, but Prefecture B has a comparative advantage beyond 1 billion pounds.
D) Prefecture B has a comparative advantage in tomato production up to 1 billion pounds, but Prefecture A has a comparative advantage beyond 1 billion pounds.
Correct Answer:

Verified
Correct Answer:
Verified
Q34: Scenario: Jack takes 3 hours to complete
Q35: Scenario: Meryl and Steve are two classmates
Q36: The following figure shows the demand curve,
Q37: A production possibilities curve is plotted for
Q38: The following figure depicts four different scenarios
Q40: Scenario: Viola and Davis are two students
Q41: The following figure depicts the production possibilities
Q42: The figure below shows the domestic supply
Q43: The following figure shows the production possibilities
Q44: Which of the following cannot be a