Multiple Choice
The following figure depicts four different scenarios in which the blue line represents California's production possibilities curve (PPC) and the red line represents Texas' PPC. These two states trade wine and cloth.
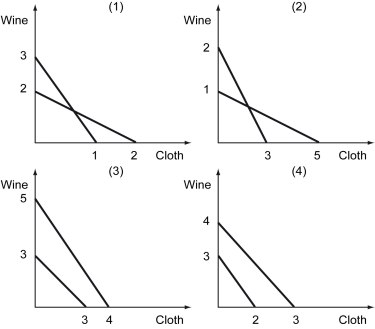
-Refer to the figure above.In what scenario(s) does Texas have a comparative advantage in wine?
A) (1)
B) (2)
C) (2) and (4)
D) (4)
Correct Answer:

Verified
Correct Answer:
Verified
Q33: The figures below show markets for solar
Q34: Scenario: Jack takes 3 hours to complete
Q35: Scenario: Meryl and Steve are two classmates
Q36: The following figure shows the demand curve,
Q37: A production possibilities curve is plotted for
Q39: The figure below shows production possibilities curves
Q40: Scenario: Viola and Davis are two students
Q41: The following figure depicts the production possibilities
Q42: The figure below shows the domestic supply
Q43: The following figure shows the production possibilities