Multiple Choice
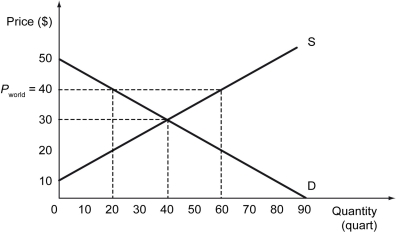
The following figure shows the demand curve, D, and the supply curve, S, for calculators in Barylia. The world price of calculators is $40.

-Refer to the figure above.Which of the following statements is true?
A) After the economy opens up to free trade, it will import 40 calculators.
B) After the economy opens up to free trade, it will export 40 calculators.
C) After the economy opens up to free trade, it will import 70 calculators.
D) After the economy opens up to free trade, it will export 70 calculators.
Correct Answer:

Verified
Correct Answer:
Verified
Q31: The following figure shows the demand curve,
Q32: If a nation opens up to free
Q33: The figures below show markets for solar
Q34: Scenario: Jack takes 3 hours to complete
Q35: Scenario: Meryl and Steve are two classmates
Q37: A production possibilities curve is plotted for
Q38: The following figure depicts four different scenarios
Q39: The figure below shows production possibilities curves
Q40: Scenario: Viola and Davis are two students
Q41: The following figure depicts the production possibilities