Multiple Choice
The following table shows the quantities of a good sold by a monopolist at different prices.
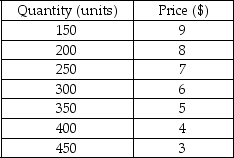
-Refer to the table above.What is the total revenue of the monopolist when it charges a price of $9?
A) $1,250
B) $1,350
C) $1,750
D) $2,250
Correct Answer:

Verified
Correct Answer:
Verified
Q192: The following table shows the different quantities
Q193: The following figure shows the market demand
Q194: The following figure is a supply-demand diagram
Q195: Several businesses and organizations in Hawaii,including hotels,practice
Q196: The following figure shows the marginal revenue
Q198: Compared to other market structures,monopolists _.<br>A) maximize
Q199: Which of the following graphs correctly represents
Q200: The total revenue curve of a monopolist
Q201: Which of the following statements is true
Q202: Scenario: When a monopolist charges $5 for