Multiple Choice
The following figure shows the marginal revenue (MR) curve and the demand curve faced by a monopolist. The monopolist faces a constant marginal cost of $3.
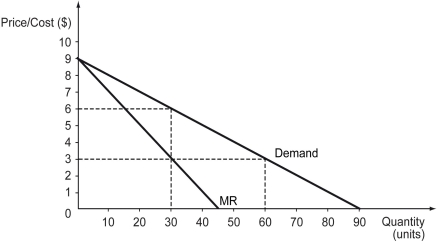
-Refer to the figure above.What is the optimal quantity that the monopolist should produce?
A) 30 units
B) 45 units
C) 60 units
D) 90 units
Correct Answer:

Verified
Correct Answer:
Verified
Q191: If a monopolist owns or controls a
Q192: The following table shows the different quantities
Q193: The following figure shows the market demand
Q194: The following figure is a supply-demand diagram
Q195: Several businesses and organizations in Hawaii,including hotels,practice
Q197: The following table shows the quantities of
Q198: Compared to other market structures,monopolists _.<br>A) maximize
Q199: Which of the following graphs correctly represents
Q200: The total revenue curve of a monopolist
Q201: Which of the following statements is true