Multiple Choice
The following figure is a supply-demand diagram that characterizes the demand, marginal revenue, and cost curves for a profit-maximizing monopolist.
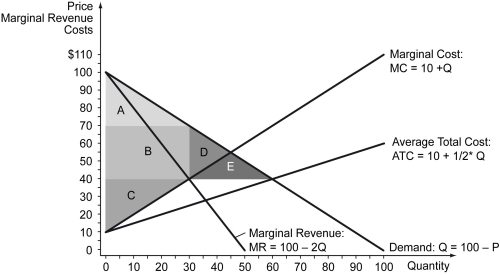
-Refer to the figure above.Under monopoly,social surplus is ________.
A) Areas A + B + C + D + E
B) Areas A + B + C + D
C) Areas A + C
D) Areas A + B + C
Correct Answer:

Verified
Correct Answer:
Verified
Q189: Which of the following statements explains why
Q190: A _ is the privilege granted to
Q191: If a monopolist owns or controls a
Q192: The following table shows the different quantities
Q193: The following figure shows the market demand
Q195: Several businesses and organizations in Hawaii,including hotels,practice
Q196: The following figure shows the marginal revenue
Q197: The following table shows the quantities of
Q198: Compared to other market structures,monopolists _.<br>A) maximize
Q199: Which of the following graphs correctly represents