Multiple Choice
The following table shows the quantities of a good sold by a monopolist at different prices.
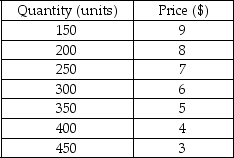
-Refer to the table above.What is the total revenue of the monopolist when it charges a price of $6?
A) $1,550
B) $1,800
C) $2,150
D) $3,200
Correct Answer:

Verified
Correct Answer:
Verified
Related Questions
Q285: A monopolist faces _.<br>A) the market demand
Q286: A fundamental feature of a monopolistic market
Q287: Scenario: Tobac Co. is a monopolist in
Q288: The following figure is a supply-demand diagram
Q289: The figure below shows the cost and
Q291: The problem of superbugs,which are bacteria that
Q292: Scenario: Tobac Co. is a monopolist in
Q293: A market structure in which identical goods
Q294: Does a monopolist have a supply curve?
Q295: In which of the following market structures