Multiple Choice
The figure below shows the cost and revenue curves of a firm in a monopoly market.
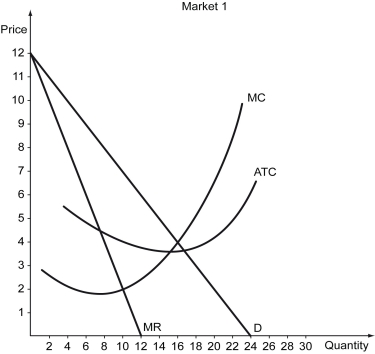
-Refer to the figure above.How much profit does this firm make?
A) $20
B) $50
C) $70
D) $64
Correct Answer:

Verified
Correct Answer:
Verified
Related Questions
Q284: Which of the following statements is true?<br>A)
Q285: A monopolist faces _.<br>A) the market demand
Q286: A fundamental feature of a monopolistic market
Q287: Scenario: Tobac Co. is a monopolist in
Q288: The following figure is a supply-demand diagram
Q290: The following table shows the quantities of
Q291: The problem of superbugs,which are bacteria that
Q292: Scenario: Tobac Co. is a monopolist in
Q293: A market structure in which identical goods
Q294: Does a monopolist have a supply curve?