Multiple Choice
The following figure is a supply-demand diagram that characterizes the demand, marginal revenue, and cost curves for a profit-maximizing monopolist.
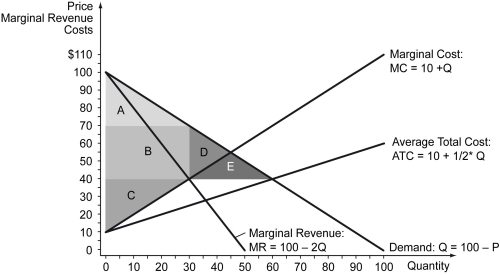
-Refer to the figure above.Under monopoly,consumer surplus is ________.
A) Area A
B) Areas A + B
C) Areas A+ B + C
D) Areas A + B + C + D + E
Correct Answer:

Verified
Correct Answer:
Verified
Q283: Which of the following is an example
Q284: Which of the following statements is true?<br>A)
Q285: A monopolist faces _.<br>A) the market demand
Q286: A fundamental feature of a monopolistic market
Q287: Scenario: Tobac Co. is a monopolist in
Q289: The figure below shows the cost and
Q290: The following table shows the quantities of
Q291: The problem of superbugs,which are bacteria that
Q292: Scenario: Tobac Co. is a monopolist in
Q293: A market structure in which identical goods