Multiple Choice
The following figure shows the demand curve faced by a monopolist.
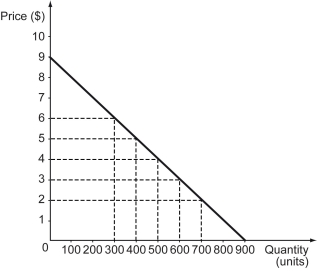
-Refer to the figure above.What is the price effect of a price increase from $3 to $5?
A) $200
B) $400
C) $800
D) $1,000
Correct Answer:

Verified
Correct Answer:
Verified
Related Questions
Q125: Which of the following statements is true
Q126: A price-maker is a firm that _.<br>A)
Q127: Which of the following firms is most
Q128: The following figure shows the market demand
Q129: A profit-maximizing monopolist produces the quantity at
Q131: The following figure shows the demand and
Q132: Scenario: When a monopolist charges $5 for
Q133: The following figure shows the marginal revenue
Q134: A monopolist faces a linear,downward-sloping demand curve.If
Q135: Scenario: Tobac Co. is a monopolist in