Multiple Choice
The following figure shows price versus quantity for a market.
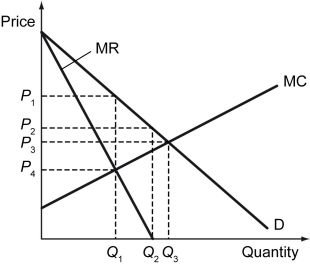
-Refer to the figure above.On what interval of quantity does total revenue increase when quantity increases?
A) From 0 to Q₁
B) From 0 to Q₂
C) From 0 to Q₃
D) Total revenue is always increasing when quantity increases
Correct Answer:

Verified
Correct Answer:
Verified
Q156: A key resource is a material that
Q157: A socially optimal price regulation will NOT
Q158: The main source of natural market power
Q159: The following figure shows the demand (D),
Q160: Second-degree price discrimination occurs when _.<br>A) each
Q162: The following figure shows the demand curve
Q163: Why does the economy of scale lead
Q164: A musician was guaranteed by the government
Q165: The following figure shows the market demand
Q166: The following figure shows the costs and