Multiple Choice
The following figure shows the costs and revenue curves of a firm in a monopoly market.
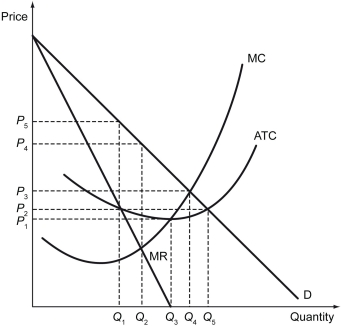
-Refer to the figure above.If this monopolist engages in the first-degree price discrimination,the consumer surplus in this market is equal to ________.
A) the area below the D curve, and above the P₂ level
B) the area below the D curve, and above the P₃ level
C) the area below the D curve, and above the P₄ level
D) zero
Correct Answer:

Verified
Correct Answer:
Verified
Q161: The following figure shows price versus quantity
Q162: The following figure shows the demand curve
Q163: Why does the economy of scale lead
Q164: A musician was guaranteed by the government
Q165: The following figure shows the market demand
Q167: The following figure shows the demand curve
Q168: The following table shows the quantities sold
Q169: The following figure shows the graph of
Q170: The following figure is a supply-demand diagram
Q171: The pricing rule for a monopolist who