Multiple Choice
The following figure shows the demand curve faced by a monopolist.
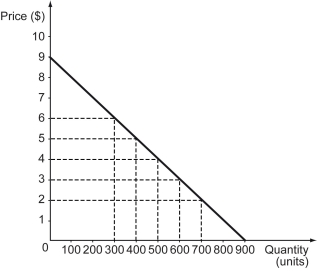
-Refer to the figure above.What is the quantity effect of a price reduction from $6 to $4?
A) $600
B) $800
C) $1,000
D) $1,200
Correct Answer:

Verified
Correct Answer:
Verified
Related Questions
Q157: A socially optimal price regulation will NOT
Q158: The main source of natural market power
Q159: The following figure shows the demand (D),
Q160: Second-degree price discrimination occurs when _.<br>A) each
Q161: The following figure shows price versus quantity
Q163: Why does the economy of scale lead
Q164: A musician was guaranteed by the government
Q165: The following figure shows the market demand
Q166: The following figure shows the costs and
Q167: The following figure shows the demand curve