Multiple Choice
The following figure shows the demand and marginal revenue (MR) curves faced by a monopolist.
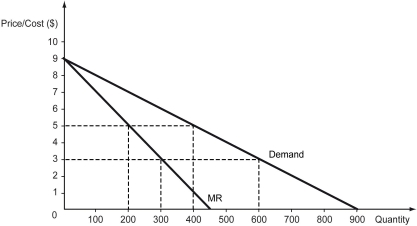
-Refer to the figure above.What is the profit-maximizing quantity that the monopolist should produce if it faces a constant marginal cost of $3?
A) 200 units
B) 300 units
C) 400 units
D) 600 units
Correct Answer:

Verified
Correct Answer:
Verified
Q44: The following figure represents the cost and
Q45: An efficient price is a price set
Q46: The following figure shows the demand curve,
Q47: What makes World's Fair of 1876,in Philadelphia
Q48: Perfect price discrimination occurs when a firm
Q50: Which of the following is NOT an
Q51: What are the different types of price
Q53: Scenario: Tobac Co. is a monopolist in
Q54: The following figure shows the market demand
Q136: The figure below shows the cost and